Spot Market Details
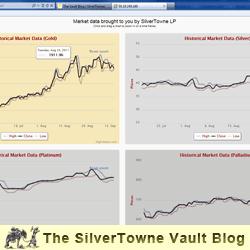
If you have ever visited www.silvertowne.com over the past several years you’ve most likely noticed a valuable service we offer to all site visitors right on our homepage. Located on the right side of the page are live real-time quotes for the precious metals market – featuring gold, silver, platinum and palladium. SilverTowne brings these quotes to you free of charge to allow you to make an informed decision when shopping for your next silver, gold or other bullion purchase – without having to search through other resources to find the information you need. While these market updates are incredibly useful in determining current SPOT prices, and the market trend over the past 24 hours, what if you want to go a little deeper in your market research? Well, now you can easily do that too thanks to the recently launched Interactive Market Detail Charts – also brought to you by SilverTowne at no cost!
Visit the Interactive Market Detail Charts page and you’ll be presented with large 12-month rolling charts displaying the high, low and closing market spot pricing for gold, silver, platinum and palladium. This "birds-eye view" provides a good overview of the trend over the past year for the precious metal you’re interested in. Hover your cursor over any of the three lines in any of the charts and you’ll be shown the date and price for that particular point in time.
Perhaps the most convenient feature of the charts is the ability to zoom in on a more detailed date range. The zoom view makes it much easier to hone in on a specific price (high, low or close) on a specific date, as the more you zoom in the more the lines tend to spread out. Zooming in also allows you to view more specific date ranges, so you can trim the chart down to a specific month, week, etc.
To use the zoom feature:
- Left click on the chart at the beginning of the range you wish to zoom in on.
- Hold your mouse button down and drag your cursor right (or left) to select your desired range.
- Release your mouse button.
Once you have your range selected you can continue to zoom in even further until you reach the timeframe you are looking for. To select a different range, simply click the Reset zoom link in the upper right-hand corner of the chart and you’ll be returned to the default home view of that particular chart.
Whether you buy silver, gold or other bullion for investing, collecting or simply to own something unique, we hope you find the new Interactive Market Detail Charts a valuable tool when researching precious metals market information. Try it out today!


